
The Covid crisis has triggered an unprecedented reaction of stock markets. In a climate of wide-spread panic, it is informative to look at the behaviour of sophisticated market agents, such as short sellers. Here, our goal is to analyse the disclosed positions of short sellers during the Covid crisis. We are interested in understanding whether short sellers anticipated the pandemic outbreak and whether they were able to profit by riding the market-wide downfall that followed.
Background
Short sellers have often been under scrutiny by regulators and the media because they can profit from a falling market. Concerns that short sellers can increase downward price pressure and exacerbate crises has led regulators around the world to ban short selling in 2008 (Beber and Pagano, 2013). To some extent, this has also occurred during the recent Covid outbreak. On March 12th, the Italian Financial Markets Authority, Consob, banned short selling on 85 stocks traded on the Italian stock exchange. More recently, following EU-wide rules, the FCA decided to tighten the threshold for short selling disclosures, making it effectively more difficult to short.
Despite these concerns, research has shown that short sellers mostly trade on superior information, often favouring contrarian positions (Boehmer and Wu, 2013.; Dechow et al., 2001). Studies have shown short sellers can predict disappointing earnings announcements (Christophe et al., 2004), negative market-wide returns (Lynch et al., 2013), and future realized correlations (Geraci et al. 2020).
Data
We collected short selling position disclosures from the FCA website. These are large short positions, net of long and delta-adjusted derivative positions, against stocks listed on the London Stock Exchange.
Following EU regulation N. 236/2012 ratified in November 2012, short sellers are required to disclose large short positions to the national regulator (in the UK, this is the FCA). The rule concerns any financial entity shorting more than 0.5% of a listed company’s market capital.
Among the stocks disclosed by short sellers, we concentrated our analysis on those stocks that were ordinary shares and whose primary trading venue was the LSE. For this sample of 475 stocks, we collect price data from Thompson Reuters EIKON.
Analysis
Figure 1 shows the number of daily disclosures published on the FCA website since the beginning of January. Every disclosure can be classified as either an origination, a closure, an increment, or a decrement. An origination is the first disclosure made by a short seller when their position passes the threshold of 5%. Similarly, a closure is the last disclosure of a short position and occurs when the threshold is passed from above. The remaining disclosures can be categorized as either a position increment or decrement.
Since mid-February the number of short selling disclosures have increased across all four categories, indicating increased activity by short sellers. From mid-February to early March, during the initial stages of the Covid outbreak in Europe, the number of position increments rose rapidly. However, beginning in March, as stock prices (bold line) continued to fall across the board, we also observed a rapid increase in the number of daily position decrements and closures. By comparison, the increase in originations i.e., new short positions, was much smaller.
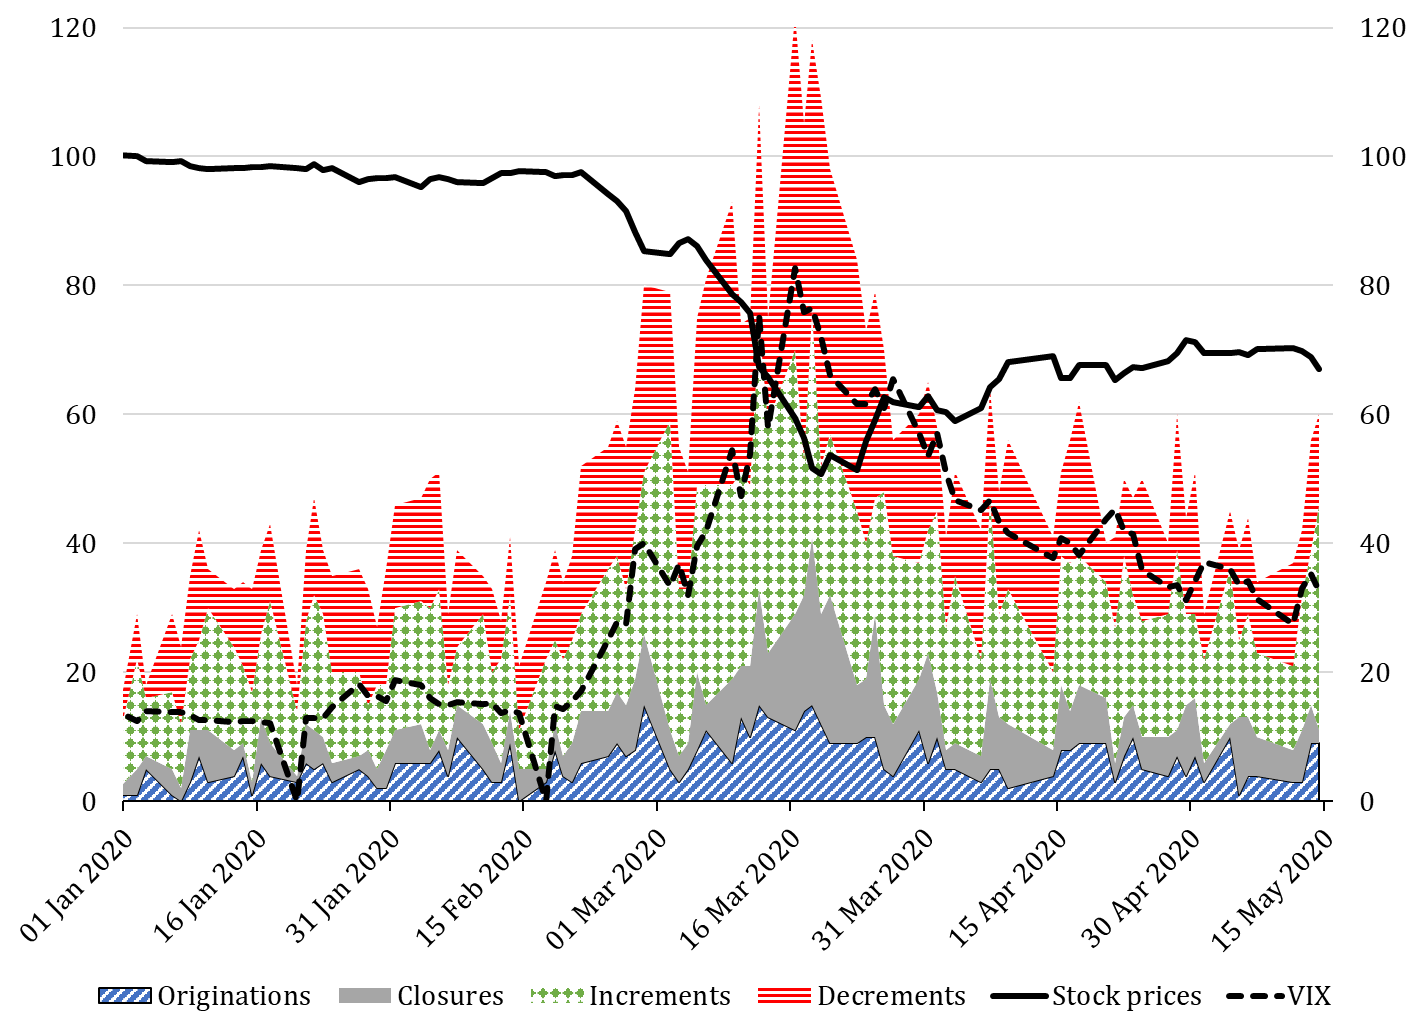
Figure 1. Short selling disclosure and price level.
Note: The figure presents the number of short selling position disclosures classified by type: originations (backward diagonal hatching - blue), closures (full - grey), increments (diamond - green), decrements (horizontal - red); the CBOE VIX (dashed), and the (equally weighted) average price level of the stocks in the sample (bold), with base period 2 Jan 2020. Short positions disclosures are from the FCA website, prices and CBOE VIX are from Thompson Reuters EIKON. All prices are in USD.
The number of disclosed short positions peaked around the 18th of March. This represented a pivotal date for the Covid crisis in the UK, as on this day the government announced closures of all schools from the following Friday, 20th of March. The decision was necessary because the virus was advancing faster than expected. As shown in Figure 1, this coincided with the peak in global volatility, indicated by the VIX, and the trough in stock prices.
To obtain a more comprehensive view, the number of disclosures should be analysed jointly with the size of short positions. Figure 2 presents the short volume and short interest for the stocks in our sample, constructed using the disclosed positions. Short volume is the total capital (in USD millions) of open short positions, whereas short interest is the percentage of market capital shorted at a given period.
During the Covid crisis, short volume fell abruptly. On the 21th of February, as Italy unveiled its first cases of Corona virus, open short positions accounted for almost $16 billion. In just over a month, the value of short positions halved.
The decrease in short volume was mostly due to the concomitant price fall of stocks. During this same period, for the 475 stocks in our sample, the level of short interest remained relatively constant, which means that the average number of shares shorted was mostly the same. If anything, short sellers slightly decreased their positions after mid-March, when the average capital short sold fell to 0.63% compared to 0.67%, the level observed during the first part of the sample.
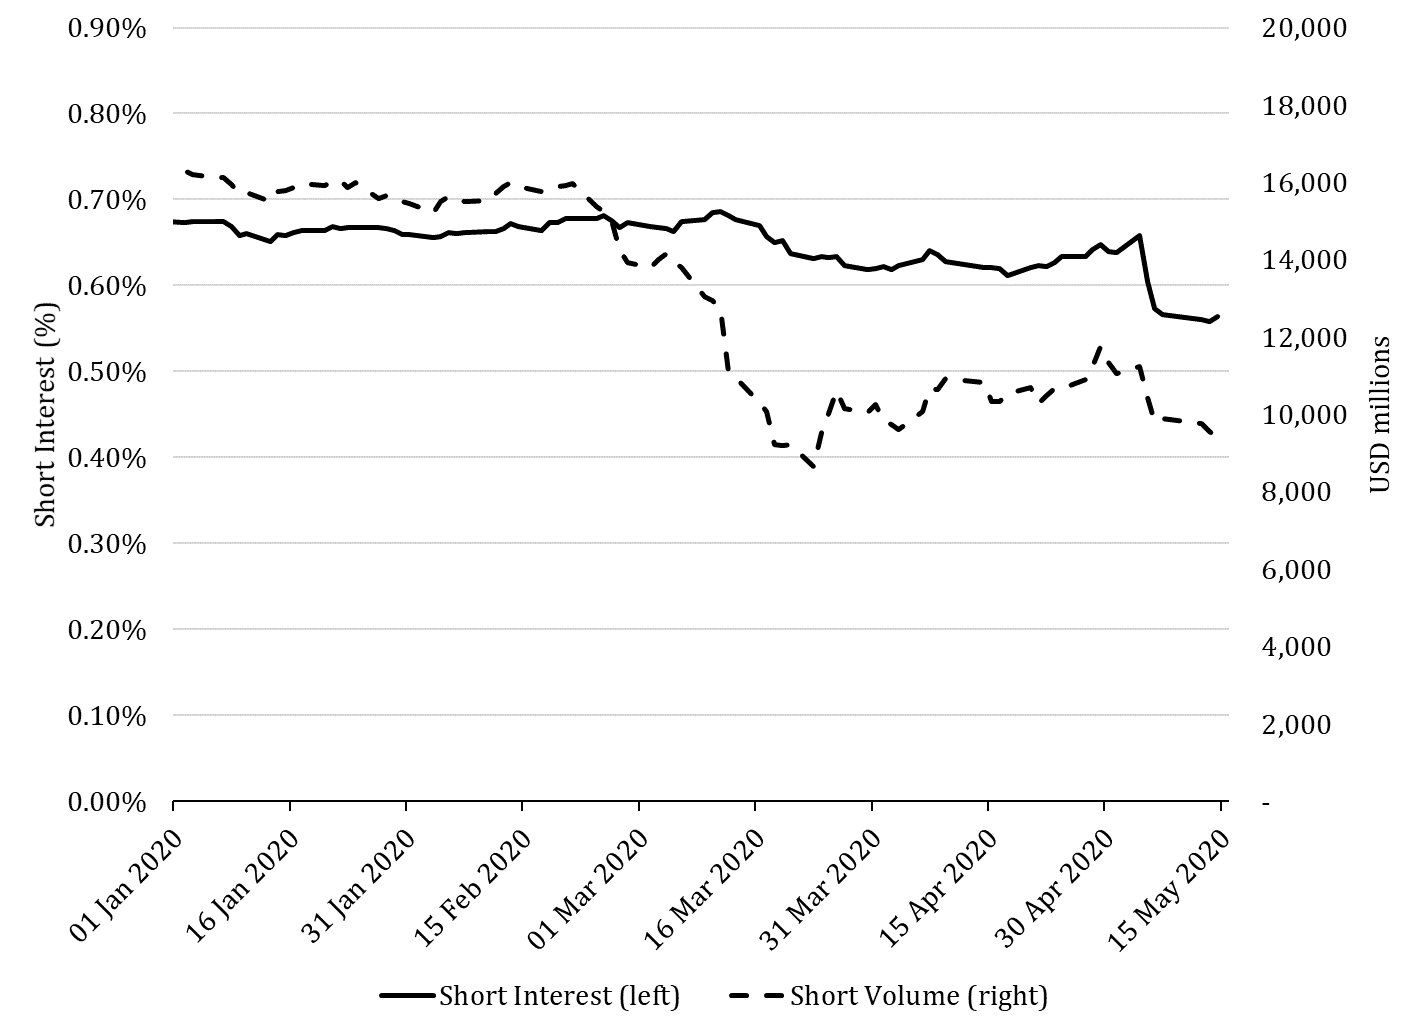
Figure 2. Short interest and short volume.
Note: The Figure shows the short interest (bold, left axis), which is the percentage of market capital short sold, and the short volume (dashed, right axis), the total value, in USD millions, of short positions. Short positions disclosures are from the FCA website, prices and shares outstanding are from Thompson Reuters EIKON. All prices are in USD.
As shown in Figure 1, during the Covid outbreak, short sellers increased the number of disclosures submitted to the FCA. These disclosed short positions were not taken by the same short sellers. Rather, as depicted in Figure 3, the number of short sellers disclosing their positions increased during the crisis. This was coupled with an increase in the number of stocks short sold, indicating that short sellers enlarged the range of stocks they were dealing.
Not all stocks were shorted equally. The disclosure data reveals that short sellers focused on some stocks more than others. We categorised stocks according to their Thompson Reuters Business Classification and computed the short interest for each sector. Figure 4 indicates that, over the crisis, consumer cyclicals had the largest increase in short interest. These are stocks that rely heavily on cyclical sectors, such as the automotive industry, housing, entertainment and retail, which were heavily hit by the Covid crisis. In comparison, short interest of non-cyclical stocks remained almost unmoved.
Notice here that the increase in short interest of consumer cyclical stocks did not anticipate the price downfall, but rather was concomitant with it. This is in line with the finding that short sellers wait for prices to decline prior to start shorting, as it is costly to sustain an unprofitable short position for long (Curtis and Farghar, 2014).
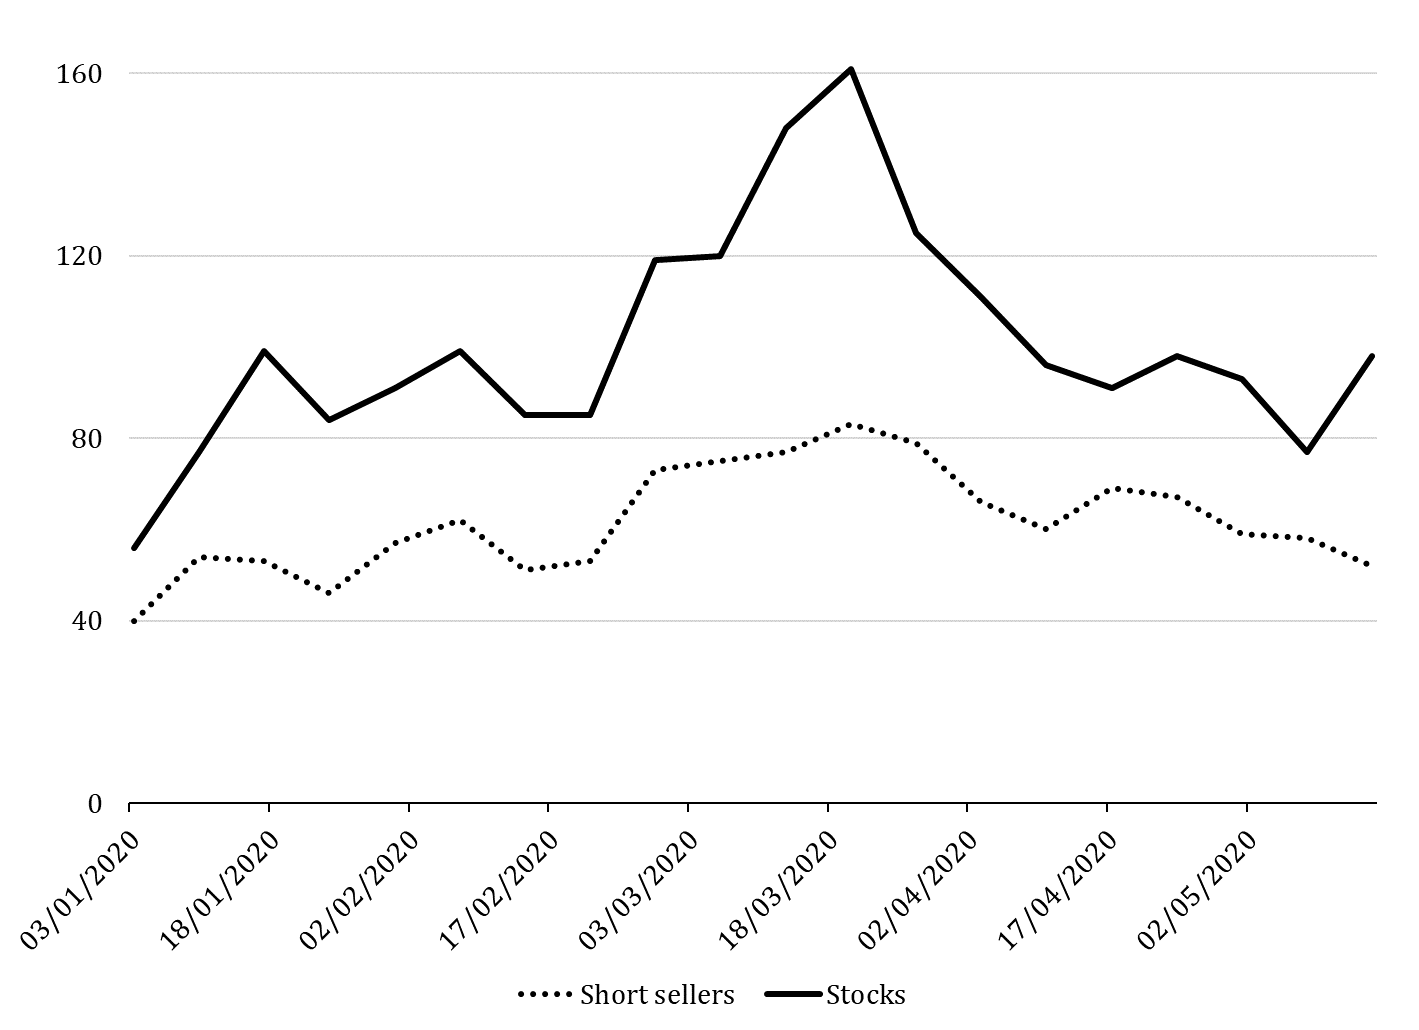
Figure 3 : Weekly number of short sellers and stocks involved in short position disclosures.
Note: The figure shows the weekly number of different short sellers disclosing positions (dashed), and the weekly number of different stocks dealt by these short sellers (bold). Short positions disclosures are from the FCA website.
Short sellers are not only known for trading on price downfalls. Decreases in their positions can also anticipate price surges (Boehmer et al., 2018). This seems to be the case for stocks in the basic materials and energy sectors in our sample---short sellers initially increased their positions and then successively decreased them after the peak of the crisis, prior to price rebounds.
Among the stocks with the lowest short interest, were those of the healthcare sector. Throughout the sample period, on average only 0.09% of these stock’s capital was shorted, with a daily maximum of 0.18%. This was much less than what was observed for consumer cyclical and industrial stocks. Financials were also avoided by short sellers during the recent Covid crisis. This might be because bank stocks and other financials are often under the eye of regulators and this might dissuade short sellers from openly shorting them (Geraci et al. 2018).
Conclusion
Overall, short sellers do not seem to have predicted the sharp stock market declines caused by the Covid crisis. They increased their short positions against heavily hit consumer cyclicals as the crisis unfolded. On the other hand, disclosed shorts show that short sellers decreased their exposure to basic materials and energy stocks, perhaps indicating that they do not believe price declines in these sectors to be sustainable for long.
Basic Materials

Consumer Cyclicals

Consumer Non-Cyclicals

Energy

Financials

Healthcare

Industrials

Technology

Figure 4 : Short interest of stocks for different sectors of the economy.
Note: The Figure shows the short interest (dashed, left axis), which is the percentage of market capital short sold, and the equally weighted stock price level (bold, right axis), for stocks of different sectors, with base period 2 Jan 2020. Stocks are sorted according to their Thompson Reuters Business Classification. Short positions disclosures are from the FCA website, prices and shares outstanding are from Thompson Reuters EIKON. All prices are in USD.
References
Beber, A. & Pagano, M. (2013). Short-selling bans around the world and evidence from the Crisis. Journal of Finance, 58:344—381.
Boehmer, E. & Wu, J. J. (2013). Short selling and the price discovery process. Review of Financial Studies, 26:287—322.
Boehmer, E.; Duong, T. X. & Huszaár, Z. R. (2018). Short covering trades. Journal of Financial and Quantitative Analysis, 53:723—348.
Christophe, S. E.; Ferri, M. G. & Angel, J. J. (2004). Short-selling prior to earnings announcements. Journal of Finance, 59:1845—1875.
Curtis, A. & Fargher, N. L. (2014). Does short selling amplify price declines or align stocks with their fundamental values? Management Science, 60:2324—2340.
Dechow, P. M.; Hutton, A. P.; Meulbroek, L. & Sloan, R. G. (2001). Short-sellers, fundamental analysis, and stock returns Journal of Financial Economics, 61:77—106.
Geraci, M. V.; Garbaravicius, T., Veredas, D. (2018). Short selling in extreme events. Journal of Financial Stability, 39:90—103.
Lynch, A.; Nikolic, B.; Yan, X. & Yu, H. (2013). Aggregate short selling, commonality, and stock market returns. Journal of Financial Markets, 17:199—229.

About the author
Dr Marco Valerio Geraci is a Cambridge-INET Postdoctoral Research Fellow, at the Faculty of Economics, University of Cambridge. His research interests lie in the field of Financial Econometrics. In particular, Systemic Risk, Financial Stability Regulation, and Asset Pricing.


